Autocorrelation finds wide application
TOM CAUGHEY and EDLEF BUETTNER
Autocorrelation measurements, which quickly became a standard method for pulse characterization of ultrafast laser pulses, continue to be used in widespread and new applications. Several pulse-characterization schemes have been developed to reveal more about the phase and asymmetry of short pulses.1, 2 The autocorrelation method, however, continues to be a widely used practical method that provides very useful information.
The autocorrelation technique
The most-common autocorrelation measurement uses the second-order autocorrelation function (τ). The autocorrelation function is defined as a normalized integral over all time of the product of a function at time t, I(t), multiplied by itself with a different value of time, I(t + τ).
l(τ) = ∫I(t) · I(t + τ)dt / ∫I(t) · I(t)dt
This function is a measure of how rapidly fluctuations dissipate, and has a maximum value when τ = 0. When I(t) is the light intensity of a laser pulse with width d, then l(τ) takes on appreciable values only when t is on the order of d; the exact relationship between autocorrelation half width and laser pulse width depends upon the temporal shape of the laser pulse.
The autocorrelation technique requires a detector that responds linearly to the product I(t) · I(t + τ) and a means to generate a delay, τ. The delay can either be repetitively generated by spinning mirrors, rotating glass blocks, or by oscillating the spatial displacement of a mirror; or the delay can be set by a spatial configuration that provides one-to-one mapping between spatial position and delay. Natural detectors of the intensity product, I(t) · I(t + t), can be phase-matched nonlinear crystals or nonlinear processes at surfaces that generate either a harmonic or a frequency-mixed output. They can also be two-photon absorbers that generate a resultant electrical or optical signal. A key point is that the material response of the detector is fast, whereas the time scale of the readout for an autocorrelation measurement is set by the rate of the delay. The resulting autocorrelation trace, l(τ), consists of the signal from the nonlinear detector as a function of delay.
Autocorrelators
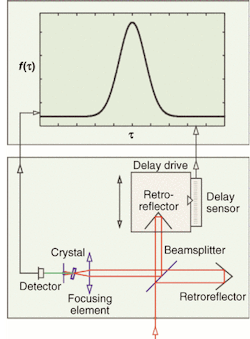
In a typical autocorrelator that uses a phase-matched nonlinear crystal followed by optical detection of the light generated in the crystal, the delay is repetitively generated by oscillating a small reflective corner cube (see Fig. 1). A feature of this autocorrelator is that all of the beams follow reflective paths to eliminate pulse broadening due to material dispersion that would be present in transmissive optics.
The autocorrelation function is obtained by splitting the pulse into two replica parts at a beamsplitter, introducing a variable delay between them, and then recombining the two pulses at the nonlinear crystal, which generates an optical signal that is detected by a photomultiplier or a photodiode. For small signal sizes, the second-harmonic signal is proportional to the product of the intensity in each pulse. Hence, the nonlinear crystal does the correlation and the parameter τ is generated by the variable delay. To obtain a faithful autocorrelation trace, the rate of change of τ is limited by the laser repetition rate and by the time required to obtain an acceptable signal-to-noise ratio of the signal generated by the nonlinear crystal. This type of autocorrelator is very versatile in the sense that crystals and detectors can be chosen to fit the operating wavelength and pulse-repetition rates and there are a number of modes in which the delay can be generated with a variety of signal-averaging schemes.
Applications
Measurements of laser oscillators using nonlinear crystals demonstrate the general applicability of the autocorrelation technique because of the availability of a wide assortment of high-quality crystals. Typical measurements include pulses from near-infrared Ti:sapphire and erbium-doped-fiber laser oscillators, the second harmonic (blue) of light from the laser oscillator, and the cross-correlation of third-harmonic (ultraviolet) light. The cross-correlation concept is similar to an autocorrelation except that the product I(t) · I(t + τ) is replaced by I1(t) · I2(t + τ), where the subscripts refer to pulses from two different lasers. Scan widths can be adjusted over approximately four orders of magnitude as well, resulting in a very versatile method for characterization of almost any short laser pulse.
Pulses from regenerative laser amplifiers have very high peak powers and are sensitive to alignment of the pulse stretcher. Autocorrelators, operating with refresh rates sufficiently fast to give a real-time feel to system alignment, aid in optimizing amplifier performance (see Fig. 2). Autocorrelators also show high sensitivity for measurement of laser diodes.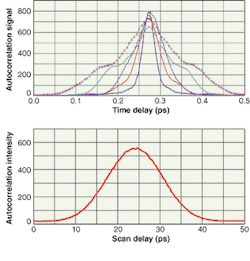
By constructing a more-dedicated autocorrelator optimized for one particular wavelength and a small number of pulse-repetition modes, smaller commercial units can be manufactured. Available options span the spectrum from the infrared to the violet (1600 to 420 nm) and pulse lengths from 20 fs to 3.5 ps; the autocorrelator measures only 9 × 16 × 13 cm.
A particularly compact autocorrelator has been designed for use with femtosecond pulses and uses a two-photon detector in place of a nonlinear crystal.3 The palm-sized unit contains all of the optics, delay stage, detector, and electronics needed to make measurements. By suitable choice of detector element, autocorrelators that use two-photon detectors are capable of measuring pulses with wavelengths at infrared, visible, and ultraviolet wavelengths.4, 5
Laser microscopy
One newer application in which the autocorrelation technique has been applied is in multiphoton-excitation experiments on biological samples.6 Because of the short temporal duration of the laser pulse, the intensity of light—which scales inversely to the pulse duration—is very high and nonlinear processes can be activated in the sample. The excitation process is sensitive to peak power, making it important to have the shortest possible pulse to excite the sample efficiently, keeping the integrated energy of each laser pulse low and mitigating the risk of damage to the specimen.
With ultrashort pulses typically 100 fs long, these pulses are broadened readily by group-velocity dispersion in any optics that intervene between the output coupler of the laser and the sample. Additionally, when tuning the excitation wavelength across the typical 720- to 950-nm output of a Ti:sapphire laser, the amount of broadening will vary with wavelength. Interpretation of the dynamics of the sample depends on understanding the temporal width of the excitation pulse.
In a type of autocorrelator designed to work with microscopes, the detector—which has the cross section of a 1 × 3-in. microscope slide—and the delay stage are separated from one another (see Fig. 3). The detector is placed right at the position of the sample in the microscope. The variable delay stage is mounted between the laser and the microscope. For autocorrelation measurements, the delay function is switched on and the autocorrelation measurement is made with the nonlinear detector. For operation of the microscope with a real specimen, the delay mechanism is switched off so that normal operation of the microscope is unaffected.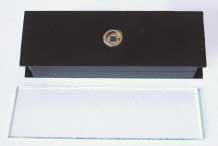
The autocorrelation technique can be used to ensure that pulses from separate lasers, or from a single laser beam that has been divided and then routed over distinct path lengths, have optimal overlap. Examples include some pump-probe experiments and coherent anti-Stokes Raman (CARS) microscopy applied to biological imaging of live samples.7, 8 In CARS microscopy, there is no net energy transfer from the laser to the sample and detection occurs at wavelengths far separated from fluorescence interferences.
REFERENCES
- D. J. Kane and R. Trebino, IEEE J Quant. Elect. 29, 571 (1993); Frequency-Resolved Optical Gating: The Measurement of Ultrashort Laser Pulses, Rick Trebino; Kluwer Academic Publishers, Hingham, Mass. (2000).
- C. Iaconis and A. Walmsley, Optics Lett. 23(10), 792 (1998).
- Y. Takagi et al., Optics Lett. 17(9), 658 (1992).
- A. M. Streltsov et al., Optics Lett. 23(10), 798 (1998).
- S. Marzenell et al., Proc. 12th Intl. Conf., Charleston, S. C., ed. T. Elsaesse, etal (2000).
- R. Wolleschensky et al., Confocal and Two-photon Microscopy: Foundations, Applications and Advances, ed. Ed, A. Diaspro, Wiley-Liss: New York (2002).
- S. Mukamel, Principles of Nonlinear Optical Spectroscopy, Oxford University Press, (1995).
- A. Zumbusch et al., Phys. Rev. Lett. 82, 4142 (1999).
TOM CAUGHEY is vice president of product development at Inrad, 181 Legrand Ave., Northvale, NJ 07647; e-mail: [email protected]. EDLEF BUETTNER is managing director of physics R&D at APE, Plauener Strasse 163-165, Haus 13, 13053 Berlin, Germany.