An unsolved mystery
The breakup of monopoly telephone companies has left the industry will little solid data on network traffic, structure, and capacity. Carriers usually have a reasonable idea of the workings of their own systems, but in a competitive environment they often consider this information proprietary. With no single source of information on national and global networks, the industry has turned to market analysts, who rely on data from carriers and manufacturers to synthesize an overall view. Unfortunately, analysts can't get complete information, and the data they do obtain has sometimes been inaccurate.
The problem peaked during the "bubble," when analysts claimed that Internet traffic was doubling every three months or 100 days. Carriers responded by rushing to build new long-haul transmission systems on land and at sea. Only after the bubble burst did it became clear that claims of runaway Internet growth were an Internet myth. A report issued in September 2002 by the Telecommunications Industry Association traces claims of three-month doubling back to a February 1997 press release from WorldCom, and an April 1998 report from the U.S. Department of Commerce, which drew its numbers from data through 1996 in an Inktomi white paper based in part on Worldcom data. Andrew Odlyzko, a former AT&T researcher now at the University of Minnesota, says that rate might have been reached during the growth spurt that came with the spread of the World Wide Web in 1995 and 1996. Since then, he says, traffic has been roughly doubling every year (see Fig. 1). That's respectable, but a factor of eight less than doubling every three months, which WorldCom continued to claim as late as 2000, although Odlyzko believes those later numbers were as misleading as WorldCom's accounting.
null
The big question now is what's really out there? How far did the supply of bandwidth overshoot the no-longer-limitless demand? All that is clear is that there are no simple answers.
Complexities of calculating capacity
The problems start with defining traffic and capacity. If there is a fiber glut, why do some calls from my Boston office fail to go through to London? One prime reason is that long-haul telephone traffic is separated from the Internet backbone. Long-distance voice traffic has been growing consistently at about 6% to 8% annually for many years. This enables carriers to predict accurately how much capacity they will need, and provision services accordingly. Declining prices and increasing competition have made more capacity available, but the real excess of long-haul capacity is for Internet backbone transmission.
Voice calling volume varies widely during the day, with a peak between 10 and 11 a.m. That is about 100 times more than the volume in the wee hours of the morning. Internet traffic also varies during the day, although not nearly as much. It's not just that hackers and programmers tend to work late at night, Internet traffic is much more global than phone calls, and some traffic is generated automatically. It also varies over days or weeks, with peaks about three to four times higher than the norm.
Average Internet volume is not as gigantic as is often assumed. Odlyzko estimates U.S. Internet backbone traffic averaged over a month in late 2002 at about 300 Gbit/s; less than half the capacity of a single fiber carrying 80 dense-wavelength-division multiplexed channels at 10 Gbit/s each. He's not alone. RHK (San Francisco, CA) analyst Shing Yin estimates North American net traffic at the end of 2002 at around 500 Gbit/s. Most analysts believe the volume of telephone traffic is somewhat lower, although the two figures are hard to compare.
null
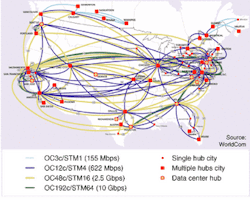
No single fiber can carry all that traffic because it's being routed to different points on the map. Internet backbone systems link major urban centers across the United States (see Fig. 2). Look carefully, and you can see that the capacity of even the largest intercity routes on the busiest routes is limited to a few 10-Gbit/s channels, while many routes carry either 622 Mbit/s or 2.5 Gbit/s. That's because some 40 companies have Internet backbones. All of them do not serve the same places, but there are many parallel links on major intercity routes.
Other factors also keep traffic well below theoretical maximum levels. Like highways, Internet transmission lines don't carry traffic well if they're packed solid. Transmission comes only at a series of fixed data rates, separated by factors of four, so carriers wind up with extra capacity—like a hamlet that needs a two-lane road to carry a few dozen cars a day. SONET networks include spare fibers equipped as live spares, so traffic can be switched to them almost instantaneously if service is knocked out on the primary fiber.
These factors partly explain Yin's estimate that current traffic amounts to only 5% to 15% of fully provisioned Internet backbone capacity. Typically established carriers carry a larger fraction of traffic than newer ones. Today's low usage reflects both the division of traffic among many competing carriers and the installation of excess capacity in anticipation of growth that never happened.
Dark fibers and empty slots
Carriers' efforts to leave plenty of room for future growth contribute to horror stories like one claiming that 95% of long-distance fiber in Oregon lies unused. It sounds bad when an analyst says that cables are full of dark fibers, and that only 10% of the available wavelengths are lit on fibers that are in use. But that reflects the fact that the fiber itself represents only a small fraction of system cost. Carriers spend much more money acquiring rights of way and digging holes. Given those economics, it makes sense to add cheap extra fibers to cables, and leave spare empty ducts in freshly dug trenches. It's a pretty safe bet that, as long as traffic continues to increase, carriers can save money by laying cables containing up to 432 fiber stands rather than digging expensive new holes when they need more capacity.
Terminal optics and electronics cost serious money, but they can be installed in stages. The first stage is the WDM optics and optical amplifiers needed to light the fiber to carry any traffic. The optics typically provide 8 to 40 channel slots in the erbium amplifier C-band. Transmitter line cards are added as needed to light channels, as little as one at a time. Although some fibers in older systems may carry nearly a full load, many carry little traffic. TeleGeography (Washington, DC) estimates that only 10% of channels are lit in the 10% of fibers that carry traffic. The glut of potential capacity is highest in long-haul systems at major urban nodes. Alan Mauldin of TeleGeography says the potential interconnection capacity into Chicago is 1800 Tbit/s, but only 1.3% of that capacity is lit. The picture is similar in Europe, where TeleGeography estimates only 1.8% of potential fiber capacity is lit. Capacity-expanding technologies heavily promoted during the bubble are finding few takers in the new, harsher climate. Nippon Telegraph and Telephone is essentially the only customer for transmission in the long-wavelength erbium amplifier L-band, because it allows DWDM transmission in zero-dispersion-shifted fibers installed in NTT's network.
null
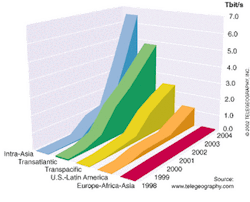
Transoceanic submarine cables have less potential capacity because the numbers of amplifiers they can power is limited. So is the number of wavelengths per fiber. Nonetheless, some regions have far more capacity than they can use. Mauldin says the worst glut is on intra-Asian routes, where 1.1 Tbit/s of capacity is lit, but the total potential capacity with all fibers lit and channels used would be 30.6 Tbit/s (see Fig 3). Three other key markets have smaller capacity gluts: transatlantic where 2.7 Tbit/s are in use and potential capacity is 12.3 Tbit/s, transpacific where 1.3 Tbit/s are lit and total potential capacity is 7.0 Tbit/s, and cables between North and South America, where 275.6 Gbit/s are lit today, and total potential capacity is 4.9 Tbit/s. With plenty of fiber available on most routes and some carriers insolvent, announcements of new cables have virtually stopped. Operators last year quietly pulled the plug on the first transatlantic fiber cable, TAT-8, because its total capacity of 560 Mbit/s on two working pairs was dwarfed by the 10 Gbit/s carried by a single wavelength on the latest cables.
The numbers bear out analyst comments that the fiber glut is less serious in metropolitan and access networks. Overcapacity clearly exists in the largest cities, particularly those where competitive carriers laid new cables for their own networks. Yet intracity expansion didn't keep up the overgrowth of the long-haul network. A study by TeleGeography found that the six most competitive U.S. metropolitan markets had total intracity bandwidth of 88 Gbit/s—50% less than the total long-haul bandwidth passing through those cities.
The real network bottleneck today lies in the access network, but is poorly quantified. The origin of one widely quoted number—that only some 5% of business buildings have fiber links—is as unclear as what it covers. Does it cover gas stations as well as large
office buildings? Even the results of TeleGeography's metropolitan network survey raise questions. It claims the six cities have "business Internet connections" totaling less than 4 Gbit/s, with only 1.4 Gbit/s from all of New York City—numbers that are credible only if they represent average Internet-only traffic, excluding massive backups of corporate data to remote sites that don't go through the Internet.
A tangled web
Although our understanding of the global network has improved since the manic days of the bubble, too many mysteries remain. Paradoxically, the competitive environment that is supposed to allocate resources efficiently also promotes corporate secrecy that blocks the sharing of information needed to allocate those resources efficiently. Worse, it created an information vacuum eager to accept any purported market information without the skeptical look that Odlyzko says would have showed WorldCom's claims of three-month doubling were impossible. Those bogus numbers— together with massive market pumping by the less-savory side of Wall Street—fueled the irrational exuberance that drove the fiber industry through the bubble and the bust.
Internet traffic growth has not stopped, but its nature is changing. Yin says U.S. traffic grew 85% in 2002, down from doubling in 2001. Slower growth rates are inevitable because the installed base itself is growing. An 85% growth rate in 2002 means that the traffic increased by 1.7 times the 2001 increase; the volume of increase was larger, but the percentage was smaller because the base was larger.
The nature of the global fiber network also is changing. In 1992, KMI Research (Providence, RI) found that just under half of the 12.2 million km of cable fiber sold around the world was installed in long-haul and submarine systems. By the end of 2001, the global total reached 460 million km of fiber, with 170 million in the United States, and only 23% of the U.S. total in long-haul systems, says Rich Mack of KMI Research. The long-haul fraction will continue to shrink.
Wall Street pessimism notwithstanding, optical system sales continue today, although far below the levels of the bubble. I expect terminal equipment sales to revive first, as the demand for bandwidth catches up with supply and carriers start lighting today's dark fibers. The recovery will start in metro and access systems, with long-haul lagging because it was badly overbuilt. We won't get as rich as we dreamed during the bubble, but in the long term we will grow better and healthier.
ACKNOWLEDGMENTS
Thanks to Andrew Odlyzko, University of Minnesota; Rich Mack at KMI Research; Shing Yin and Anurag Dwivdei at RHK; and Alan Mauldin at TeleGeography.
RESOURCES
TeleGeography: http://www.telegeography.com
KMI Research http://www.kmiresearch.com
Telecommunications Industry Association: http://www.tiaonline.org/
Research by Andrew Odlyzko: http://www.
dtc.umn.edu/~odlyzko/doc/complete.html


