Femtosecond sources solve a higher-order problem
Eric Van Stryland, Raluca Negres, Joel Hales, and David Hagan
Measuring nonlinear absorption and refraction through materials challenges spectroscopists. The tunable femtosecond source has opened the field to scientists who are not "laser jocks."Spectroscopists measure the absorption of a material as a function of wavelength (λ). There are a variety of commercial spectrometers for linear spectroscopy, but the most common are grating spectrometers, which monitor the transmittance of a sample versus wavelength. Knowing the sample thickness or solution concentration allows the user to determine the wavelength dependence of fundamental optical constants, such as the linear absorption coefficient [a(λ)]. In nonlinear spectroscopy, there are many more wavelength-dependent parameters that can be measured, such as second-harmonic-generation coefficients, Raman gain, nonlinear refraction, and nonlinear absorption.
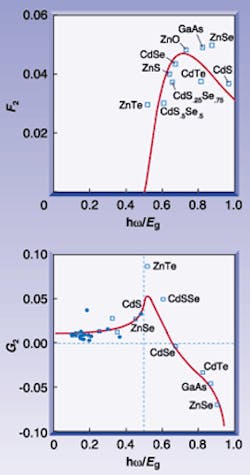
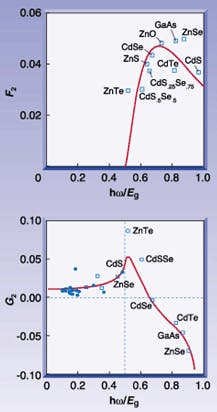
FIGURE 1. Spectral dependence of two-photon absorption in semiconductors (F2) after scaling for bandgap energy differences (top). Spectral dependence of the bound electronic n2 in semiconductors and dielectrics (G2) after scaling for bandgap energy differences (bottom).
Here we discuss nonlinear absorption (NLA), including comments on the associated nonlinear refraction (NLR), where the polarization, Pthe driving term in Maxwell's wave equationis third order in the input field. Since the nonlinear polarization is generally small, researchers usually resort to using high-intensity pulsed laser sources. This has severely restricted the field of nonlinear spectroscopy because until very recently, only a few wavelengths were easily accessed.
With the availability of tunable laser sources, and more recently, widely tunable optical parametric sources, the field has opened to researchers who are not "laser jocks." (By adding frequency mixing, commercial systems can offer tunability from 250 nm out to 10 µm.) To obtain reliable NLA measurements, the nonlinear spectroscopist must pay careful attention to the source irradiance, I, as a function of excitation wavelength, le. This added requirement over linear spectroscopy makes measurement infinitely more difficult. The laser energy and the temporal and spatial modes (and any possible changes with propagation through the sample), must be accurately monitored at each excitation wavlength to determine I(λe) = energy(λe)/area(λe)/time(λe).
Despite these problems, there have been numerous successes in determining nonlinear spectra of many materials with only a couple of wavelengths. For example, the Z-scan method, which monitors the transmittance as a function of sample position with respect to the focal beam waist, has proven quite useful in separately measuring nonlinear absorption and refraction at single wavelengths. The single bandgap energy, Eg, determines most of the linear optical properties of semiconductors and dielectric materials. Conveniently, this also is the case for the two-photon absorption (2PA) coefficient b, and for the bound-electronic NLR index, n2 (see Fig. 1). These are the lowest-order ultrafast nonlinearities that can occur for a single input excitation wavelength. For 2PA in semiconductors, the photon energy lies between Eg/2 and Eg. However, for materials with more complicated electronic structure, such as complex organic compounds, multiple 2PA bands can occur. To date, no consistent theory of structure-property relations can predict these spectra, and the database of nonlinear spectra is very sparse. To fill this void, a method is needed to rapidly monitor the nonlinear spectra.
Nonlinear problem and solution
The "simplest" nonlinear spectrometer we can envision is one in which the transmittance of a tunable, high-power source is measured as a function of le at high input irradiance and low irradiancelow enough that the linear transmittance is monitored. The difference between these two measurements gives the degenerate NLA spectrum, Da(le). Unfortunately, it is difficult to keep the irradiance fixed while tuning, since the energy changes (commercial systems give a "tuning curve" that shows energy per pulse vs. l). The spot size and pulsewidth can also vary. For femtosecond sources, autocorrelation measurements are needed to determine the pulsewidth. Luckily, the pulsewidth of some of these systems is found to be fairly constant over reasonable spectral ranges.
Assuming the irradiance cannot be held constant while tuning le, the spectra must be corrected for this variation, which is relatively straightforward. A plot of the inverse transmittance vs. irradiance is a straight line of slope proportional to b as long as Da is not too large. Checking this at several values of excitation wavelength will verify the third-order response, but not differentiate 2PA from the two-step process of excited-state absorption. This type of absorption is the process of sequential absorption of two photons, thus requiring an initial linear absorption to create the excited state. If a higher-order nonlinearity exists, it will be revealed by the irradiance dependence. The above requirements can make 2PA spectral measurements difficult and tedious. Fortunately, there are alternatives, one of which can also yield information on the nonlinear refraction.
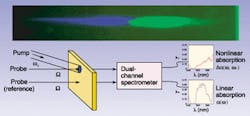
Femtosecond sources above 1 µJ are capable of producing white-light continua (WLC) that can extend over very large wavelength ranges, depending on the material used and pump wavelength. For example, we use a WLC that covers the range from 450 nm to 2 µm. This WLC provides an ideal source to probe the absorption spectrum; however, it is not intense enough to measure the nonlinear absorption directly. Used as a probe in a "pump-probe" configuration, the probe transmittance gives a measure of the nondegenerate NLA (see Fig. 2). The reference monitors the linear transmittance spectrum so that finding Da(l:le) is straightforward. Here Da is the change in transmittance of the probe at l due to the presence of the intense pump at le. This takes us back to the earliest measurements of NLA.
Kaiser and Garrett first saw two-photon fluorescence in 1961 (reported in the same issue of Physics Review Letters as Peter Franken's second-harmonic generation experimentthe dawn of nonlinear optics).1 In 1963, Hopfield, Worlock, and Park monitored 2PA in the spectral transmittance of a flashlamp probe source through potassium iodide excited with a ruby laser.2 This nondegenerate NLA essentially linearizes the problem for the application of causality so that the nondegenerate NLR can be calculated from Da(l:le) via Kramers-Kronig relationsin other words, the sample with the le beam on has a changed absorption spectrum.3
Spatial overlap of the pump and probe is relatively easy to achieve by using a pump beam that is large compared to the spatial extent of the probe. Then the probe sees a uniformly excited region. On the other hand, the temporal overlap can be problematic. Since this WLC is generated by focusing in materials such as sapphire, it must propagate through materials that have group velocity dispersion that makes the bluer end of the probe spectrum arrive at considerably later times than the red end. Additionally, because the pump and probe pulses propagate at different speeds, they can "walk" through each other in the sample.
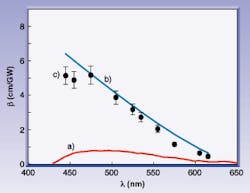
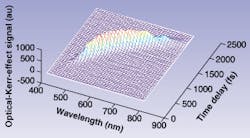
This temporal walk-off requires changing the relative delay between the pump and probe, giving temporal information concerning the nonlinear response. While degenerate NLA cannot distinguish between nonlinearities such as excited-state absorption and 2PA, the temporal information in a femtosecond pump-probe experiment will clearly show the excited states living after the pump has passed for excited-state absorption. However, the femtosecond probe must be well characterized in time. The temporal walk-off can severely distort the NLA spectrum because different wavelengths overlap at different times. However, the spectral data can be corrected if the group velocity dispersion of the sample is known (see Fig. 3). If it is not known, it can be measured by spectral interferometry or by using the pump-probe configuration in known nonlinear materials involving instantaneous nonlinear processes such as the optical Kerr gating effect (see Fig. 4), 2PA, or second-harmonic generation.
These measurements also reveal the WLC pulsewidth vs. l, which is needed to determine the 2PA interaction. Luckily, this turns out to be nearly constant. We conclude that nondegenerate NLA can give relatively rapid measurement of a sample's nonlinear response.
The two-photon fluorescence solution
A different method that works quite well for fluorescing samples is two-photon fluorescence spectroscopy.
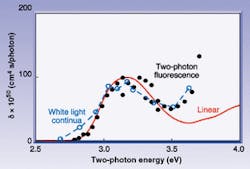
In this method, a strong tunable pump beam excites a material via 2PA, and the total integrated fluorescence is monitored as a function of input frequency and irradiance. After correcting for the irradiance changes with wavelength, and ensuring that the fluorescence spectrum is independent of le (not always the case), the degenerate 2PA spectrum is deduced (see Fig. 5). This two-photon fluorescence method is directly applicable to the burgeoning field of two-photon "confocal" microscopy that can give three-dimensional images of microscopic samples.
Knowledge of nonlinear absorption spectra as well as the dispersion of the nonlinear refraction is important for many of the new devices for all-optical switching in optical telecommunication, for optical limiters used in sensor protection, and for high-power lasers. For example, the NLR in sapphire is responsible for the production of femtosecond pulses in most commercial systems. A more complete database of nonlinear spectra should lead to a better understanding of how to predict and control these processes.
REFERENCES
- W. Kaiser and C. B. G. Garrett, Phys. Rev. Lett. 7, 229 (1961).
- J. J. Hopfield, J. M. Worlock, and K. Park, Phys. Rev. Lett. 11, 414 (1963).
- D. C. Hutchings et al., Opt. and Quant. Elect. 24 (1992).
ERIC VAN STRYLAND is professor of optics; RALUCA NEGRES and JOEL HALES are Ph.D. candidates; and DAVID HAGAN is associate professor at the School of Optics/CREOL, University of Central Florida, Orlando, FL 32816-2700. Tel: 407-823-6814; e-mail: [email protected].
