Spectrometers move out of the lab
Rob Morris
Though the first spectroscope was developed nearly 200 years ago, only in the last decade or so has spectroscopic instrumentation escaped the confines of the laboratory. Thanks to a fortuitous combination of circumstancesthe mass production of optical fibers, the development of less costly and more efficient detectors and optics, and the emergence of personal computersthe practical application of spectroscopy has expanded beyond the lab and into the field, into the factory, and even into the human body. In fact, applications once thought impossible, or at best, impractical, are now nearly commonplace, using real-time, in situ spectroscopy.

Two hundred and fifty years after Isaac Newton's experiments with prisms, the modern era of spectroscopy began in industrial applications in World War II. In 1940, Arnold Beckman introduced what is generally considered to be the first commercial ultraviolet-visible (UV-VIS) spectrophotometer, the Beckman DU. Today, spectroscopy and related optical-sensing technologies are part of a multibillion-dollar industry, with instrumentation and applications as diverse as they are dynamic. There are more than 50 types of spectrometers in common commercial use, from atomic absorption to x-ray fluorescence instruments. One of the most common is the UV-VIS spectrometer with a linear-charge-coupled-device (CCD)-array detector.
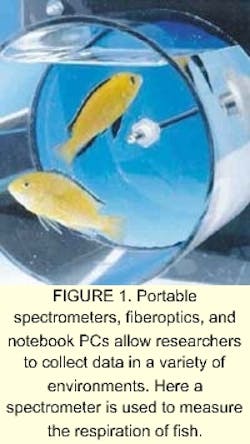
Applications of spectroscopy extend to nearly every field of science, including medicine, chemistry, geology, physics, and astronomy. Spectral information has been sampled from the sea floor of Earth to the dusty red plains of Mars. Both the underlying science and practical implementation of spectroscopy continue to develop, with several advances in the last decade dramatically expanding opportunities in a remarkable variety of disciplines and industries (see Fig. 1).
The "fax" track
It's hard to imagine a world without fax machines, personal computers, or the Internet, yet only in the last decade or so has the electronics revolution really taken off. As a result, mass-market economies of scale have dramatically cut the cost of several critical elements of spectroscopic sensing systems, especially detectors, optical fibers and PCs.
Consider detectors. The CCDs now used in some UV-VIS spectrometers also have been integrated into mass-market devices such as camcorders and fax machines. A decade ago, the fax machine was something of a novelty. By 1997, the home office market for fax machines had become a $328 million industry. This demand has helped to drive down the cost of CCD-array detectors to hundreds vs. thousands of dollars per detector, and has reduced pricing barriers that previously limited spectral-sensing options for researchers and product developers.
As scientific-grade CCD-array detectors have become more affordable, spectrometer optical benches have become smallerwith little or no sacrifice in performance. The trend toward miniaturization dates to the early 1990s, with the introduction by Ocean Optics Inc. (Dunedin, FL) of a CCD-array spectrometer small enough to fit inside a PC, and portable enough to bring the sensor to the sample. Now, more than a dozen manufacturers worldwide offer some version of a "miniature" fiberoptic spectrometer. Last year, Optical Coating Laboratory Inc. (Santa Rosa, CA) introduced a linear variable filter-based spectrometer that's just 66 x 66 x 29 mm including electronicssmaller than a credit card.
Hence, applications that were previously cost-prohibitive are now quite feasible. For example, laboratory spectrophotometers traditionally have been used to monitor the color or chemical composition of a finished product. Now, dozens of inexpensive spectrometer modules can be installed into process lines or transported into the field. This modular approach makes multiple-point sampling and redundant sensing much simpler to integrate into applications, thus reducing the cost per sensor and producing more reliable data.
Another consequence of smaller, lower-cost spectrometers and optical benches is the ability of new product developers and original equipment manufacturers to integrate components into other analytical devices. For example, Raman Systems Inc. (Boston, MA) embedded a cooled CCD-array detector into a portable system for chemical analysis using low-resolution Raman scattering. By keeping the size and cost of the system's sensing component smallanalyzers weigh fewer than 8 lb. and start at a reasonable $10,000Raman Systems filled a niche previously limited to considerably larger and more expensive research-grade Raman analyzers and Fourier-transform IR systems.
Fiber, fiber everywhere
Spectroscopy users today have benefited greatly from the explosive growth of the telecommunications industry. Optical fiber acts as a waveguide, "guiding" light from samples to spectrometer detectors. The notion of commercially viable fiber-based spectroscopy dates at least to the early 1980s, with a fiberoptic spectrophotometer developed by Guided Wave (El Dorado Hills, CA) for use in chemical, petrochemical, and other process industries. Perhaps the most valuable feature of a spectroscopic system is system flexibility, which is afforded by the use of optical fiber.
Fiber can transport light over great distances and around corners, and can be used to couple spectroscopic components into a modular system. Modularity permits dynamic configuration by the user. Conversion of optical systems from transmission to reflection or fluorescence, for example, is as simple as attaching and detaching spectrometers, light sources and sampling optics from the fibers to which they are connected.
Most significantly, optical fiber brings the spectrometer to the sample. Smaller sizes permit installation on production lines, in process streams, and in injection-molding machines and other hard-to-reach locations. With suitable connectors and fixtures, fiber assemblies can be used in vacuum chambers for monitoring real-time thin-film deposition or in marine environments to measure the amount of light absorbed by phytoplankton or fluoresced by corals (see "Spectrometers shed light on ocean floor," p. 78).
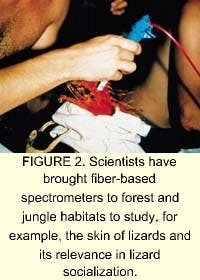
Examples of applications made possible by fiberoptics are numerous. Researchers have taken spectrometers, light sources, and fiberoptics into forests from French Guiana to Sweden to measure the reflectance of bird plumage in order to better understand the nature of color-based mate selection (see Fig. 2). In Puerto Rico, spectroscopic equipment has helped biologists learn more about the UV reflectance of lizard bodies, because UV-range pigments play a role in lizard socialization. Color also plays a role in mate selection among the cichlid fish of Africa's Lake Victoria, as researchers using a miniature spectrometer and fiberoptics have discovered.
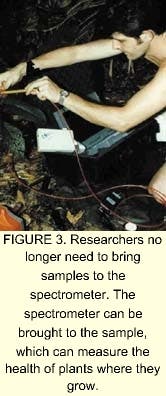
Fiber-based spectrometer systems have been used to measure the health of plants (see Fig. 3), to quantify gasoline and other contaminants in soil and water, and to determine the chemistry of rock samples in Antarctica. And, though NASA took an x-ray spectrometer on its maiden voyage to Mars, future expeditions are likely to integrate fiber-based spectrometers into the robotic "rovers" that sample the planet's surface. The Mars spectrometer will gather reflected visible and near-infrared light from samples on the planet's surface to a resolution of 0.5 nm, and convert it to analog signals, which are then read by the host computer.
The PC factor
The coupling of CCD-array spectrometers with computers yields high-speed, high-resolution spectral data that is much more sophisticated than data obtained from single-wavelength devices. The personal computer has greatly lowered the cost and speed of spectral data acquisition, processing and storage, and has made computationally intensive analyses commonplace.
For instance, researchers at the University of South Florida (Tampa, FL) have used complex modeling techniques to extract spectral information about the size, shape, chemical composition, surface charge, and internal structure of micron and submicron-sized particles in a variety of samples. Analyses have covered applications such as the detection of infectious diseases in blood and of bacterial contamination in water.
Advances in hardware have also had significant impact. Computers have become faster, smarter and more portable, giving researchers greater access to samples and allowing them to collect data in situ, in real time. Today, an entire spectroscopic systemspectrometer, light source, fiberoptics and notebook PCcan easily fit into a knapsack or briefcase.
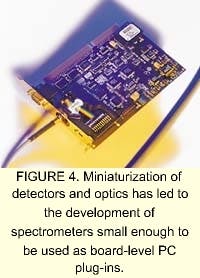
The next-generation PCs are even smaller and easier to use. Handheld PCs make the laptop look positively gargantuan by comparison. The Universal Serial Bus (USB) port on newer PCs eliminates the hassles of opening up the computer chassis to connect devices; 95% of all new desktop and notebook PCs are likely to support USB by 2003. Some spectrometer manufacturers have taken advantage of these developments to create new types of spectrometer-PC interfaces (see Fig. 4). Others will follow suit as the latest gadgetry penetrates the market.
All the advances in spectroscopy in the last decadethe breakthroughs in detectors, optics, and fiberscould be only the tip of the iceberg. Imagine being able to inexpensively deploy thousands of spectrometer sensors around the world, each collecting live data instantly accessible via the Internet. You wouldn't even need a PC, just a handheld device to go online. After all, cellular phones, PDAs, and other appliances with Internet accessibility already exist.
It's not entirely out of the realm of possibility: a wireless spectral sensor that's very small, consumes little power and has built-in communications protocols that allow it to "talk" over the Internet. Such a spectrometer-as-web appliance would have an enormous effect on research, with implications for everything from how we combat the outbreak of disease to what crops we plant and when.
The possibilities are limited only by the imagination.
ROB MORRIS is marketing manager at Ocean Optics Inc., 380 Main St., Dunedin, FL 34698; e-mail: [email protected].
_________________________
Mazel, now a principle research scientist at Physical Sciences (Andover, MA), built several versions of underwater spectrometers for large-scale case studies of the seafloor. The small size of spectrometers and the use of fiberoptics have been major advances for reducing the bulk of spectrometer systems.
The new, smaller spectrometer makes it easier for divers to handle the instrument while underwater (see Fig. 1). "I used to have to take a sample from a dive and carry it back to the lab to obtain a spectrum," said Mazel. "Now I can get multiple spectra from many different sourcessand, corals, algae, anemonesall in one trip."
Decreasing the power requirements of spectrometers lowers the weight and size of the battery, furthering the portability factor. "The fact that it's power conservative means it can be run off of a battery as small as 12 V-2 amp hours."
The fluorescence research has helped to establish the optical properties of different objects on the sea floor (see Fig. 2). "For example, the spectral signature of the green in anemone is similar to the green spectra of corals," said Mazel, "which tells us there must be a limited range of substances causing the fluorescence." Data collected by the BSF also contributed to the selection of appropriate detection wavelengths in subsequent remote-sensing systems.
Valerie C. Coffey