How to measure relative intensity noise in lasers
GREGORY E. OBARSKI and PAUL D. HALE
Historically, a dichotomy has existed within semiclassical theory between laser relative intensity noise (RIN) and Poisson, or shot, noise. The dichotomy arose because photocurrent shot noise was attributed solely to the photodetection process. A quantum-field description of laser noise shows, however, that shot noise also arises from fundamental fluctuations in the photon stream. This is the minimum or quantum-noise limit for a laser in a coherent state. Poisson noise on the optical signal and shot noise on the photocurrent are indistinguishable in the detector output but they can be separately determined from physical laws.
Laser RIN is often associated with transmission of optical data, so we focus primarily on diode lasers, although the basic ideas are applicable to all classes of lasers. In analog communication systems, such as cable television, total RIN within the system bandwidth can limit the signal-to-noise ratio. In high-speed digital systems, RIN can limit the bit-error rate and system performance under certain conditions. The high-frequency RIN spectrum of a laser often contains a well-defined peak at the relaxation oscillation frequency, and in many classes of lasers this peak can be used to deduce the maximum intrinsic modulation frequency for a specific laser.
Knowledge of RIN can be used when designing new lasers to improve their performance for specific applications. Very-low-RIN lasers are used to determine the noise figure of optical-fiber amplifiers, which are essential for building faster and more-efficient optical communications systems. Demand for better techniques to calibrate the response and sensitivity of a RIN-measurement system is also increasing with the appearance of commercial distributed-feedback lasers and diode-pumped Nd:YAG lasers exhibiting very low RIN.
Laser RIN depends on many quantities, the most important of which are frequency, output power, temperature, modulation frequency, time delay and magnitude of optical feedback, mode-suppression ratio, and relaxation oscillation frequency. For certain kinds of multimode lasers, RIN can also be affected greatly by system components that have polarization or wavelength-selective properties. The predominant source of RIN, however, is usually spontaneous emission. Hence, low-frequency RIN is at a maximum just above threshold, diminishing with increasing output power—but it can be increased greatly by optical feedback, even at high output power
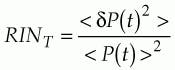
where the time average < dP(t)2> arises from the autocorrelation function
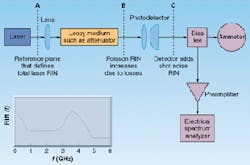
Although RIN can be determined using optical-correlation techniques, it is often measured in the electrical domain by direct detection. In this case the dc photocurrent output from a detector illuminated by a test laser is measured, and the ac noise on the detector output is amplified and then displayed on a radio-frequency (RF) spectrum analyzer. The RIN simplifies to the ratio of ac to dc electrical powers, respectively (see Fig. 1).
We denote the frequency spectrum of relative intensity noise as R(w) and define this as the relative intensity noise of the laser. In the electrical domain, we weight the measured noise power per unit bandwidth PE(w) measured on an RF spectrum analyzer with the frequency response of the detection system, C(w), and divide by electrical dc power P. Thus,
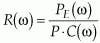
where PE(w) is the noise after subtracting the thermal noise floor.
Using the convention that R(w) is a single-sided spectral density, the total RIN (RINT) is also the integral of R(w) performed over the finite bandwidth of the system, BW. Total RIN can be measured using an electrical filter and RF power meter in place of the spectrum analyzer. Hereafter, we denote the RIN frequency spectrum (spectral density) simply as "RIN" and the integral of the RIN over the system bandwidth as "total RIN." RIN is specified in units of Hz-1, or (in logarithmic form) as dB/Hz with typical values of -110 to -130 dB/Hz for inexpensive multimode edge emitters-it can be less than -170 dB/Hz for high-quality distributed-feedback lasers.
Laser RIN is comprised of two parts: a Poisson component and a component we refer to as "excess RIN." The "Poisson RIN" is the minimum RIN achievable with classical light. It is often called the standard quantum limit. For optical power Po, the Poisson RIN is 2hn/Po, where h is Planck`s constant and n is optical frequency. In electrical units it is 2q/i, where q is electron charge, i = hqPo/hn is photocurrent, and h is photodetector quantum efficiency. Hence, the Poisson RIN in a real detection circuit increases as 1/h. The excess RIN describes the deviation from Poisson statistics. It is non-negative for classical light and zero for Poisson light. An ideal photodetector with no losses-one electron for each photon incident on the detector-would detect the true laser RIN.
Under special conditions, we may produce photon-number squeezed light in which the variance of the photon number is squeezed below the Poisson limit at the expense of increased phase noise. The total RIN of such light is smaller than the Poisson limit. Theoretically, there is no limit to the magnitude of squeezing we can achieve-although experimental results re main less than 10 dB of squeezing. Attenuation reduces the magnitude of the squeezing by adding Poisson noise back into the beam.2,4,5
In Fig. 1, the beam traverses a lossy medium, such as an attenuator, and is collected by the photodetector. R(w) is to be determined at reference plane A, before any losses. The Poisson component of the RIN is increased at plane B due to losses and again at plane C due to inefficiency in the photodetection process. System efficiency can be combined into one factor hT = h(1-L), where L is the fractional loss before the detector. The excess RIN, however, propagates unchanged through the system. If RC(w) is the measured RIN at plane C (which includes Poisson RIN), then the laser RIN is given by
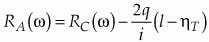
The excess RIN, Rex(w), is determined by subtracting the measured shot noise RIN, 2q/i, from RC(w), giving the traditional formula Equation 4 is equivalent to subtracting the Poisson RIN from the RIN at plane A.
Figure 2 shows that total RIN increases as optical power decreases; this is due to increasing Poisson RIN. Thus, total RIN can be much greater than excess RIN. As power approaches infinity (or even 1 W), Poisson RIN approaches 0 and total RIN approaches excess RIN. However, because low power has large Poisson RIN, significant errors can occur in determining low-magnitude excess RIN. Attenuation can further magnify this effect because its net effect is to increase Poisson RIN but leave excess RIN unchanged. High attenuation can diminish the ability of a measurement system to accurately determine excess RIN. Indeed any optical source can be made shot-noise-limited with sufficient attenuation.3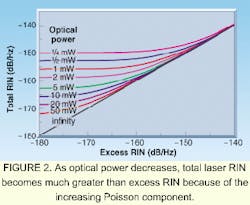
Sometimes the signal-to-noise ratio is used instead of RIN. For Poisson-limited light under full modulation it is hPo/2hn. Sometimes the signal-to-noise ratio of optical power is expressed as the square root of the signal-to-noise ratio of electrical power, giving (hPo/2hn)1/2. The distinction between these definitions is equivalent to the definitions of the optical and electrical bandwidth for detectors and modulators.6 The deciding factor is whether one wants to measure root-mean-square voltage fluctuations or power. We can always relate total RIN or its components to signal-to-noise ratio.
Several methods can be used to calibrate RIN measurement systems. At NIST we are studying the RIN of optically filtered, amplified spontaneous emission from an erbium-doped fiber amplifier for potential use as a RIN transfer standard.7 We are also applying Poisson limited light and heterodyne methods.
We have defined RIN as the RIN frequency spectrum and total RIN as the integral of the RIN frequency spectrum. Thus, total RIN is the sum of the spectral integrals of excess RIN and Poisson RIN. Excess RIN propagates unchanged through the system while Poisson RIN depends on system losses. Both components can be described by the semiclassical theory.
ACKNOWLEDGMENTS
The authors thank John Kitching of NIST for useful conversations on the subject matter.