PLASMONICS-INDUCED FLUORESCENCE: Temperature mapping at the nanoscale
GUILLAUME BAFFOU, MARK KREUZER, FLORIAN KULZER, AND ROMAIN QUIDANT
Unlike light, which can propagate in the far field and in vacuum, diffusive temperature propagation remains confined to regions near the sources of heat. This fundamental difference explains why numerous optical microscopy techniques exist and continue to be actively developed, while thermal microscopy is still in its infancy. Nonetheless, in addition to the fundamental interest of investigations into nano-thermodynamics, understanding and monitoring temperature processes at the nanoscale using thermal microscopy could be beneficial for many practical applications in physics, chemistry, and biology.
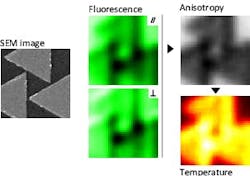
At the Institute of Photonic Sciences (ICFO), Barcelona, the Plasmon Nano-optics group has developed a thermal imaging technique that allows for temperature mapping around nano-sources of heat with spatial resolution of about 300 nm and temperature accuracy down to 0.1°C.1 Basically, the technique consists of surrounding the area of interest with a solution of appropriate fluorescent molecules and mapping the fluorescence polarization anisotropy (FPA).
A direct measurement of Brownian dynamics
The underlying physics of FPA are well established. Techniques related to fluorescence polarization anisotropy are already used, mostly in biology or polymer science, to probe the local viscosity of a fluid or to study molecular self-organization. When a population of randomly distributed molecules is illuminated by linearly polarized light, the subsequent fluorescence turns out to be partially polarized. The depolarization comes from the random orientation of the fluorophores. When the molecules are free to move within a fluid, an additional depolarization effect can appear depending on how fast the molecules are rotating (due to Brownian motion) compared with the fluorescence lifetime.
Basically, if the molecules have time to rotate significantly during the fluorescence lifetime, this leads to a substantial decrease in the FPA. For a well-selected fluorophore/fluid combination, temperature variations of a few degrees can be accompanied by a significant variation in the FPA. The thermal imaging technique presented by ICFO researchers is based on this physics; since FPA is a direct measurement of the Brownian dynamics of the molecules, it appears to be highly reliable and the most natural way to probe local temperature.
In practice, a strong variation of the FPA is observed for fluorescein molecules in a water-glycerol mixture. Fluorescein molecules are known to be highly photostable and to have a quantum efficiency close to 1. Glycerol undergoes a strong variation in its viscosity with temperature, making the technique even more sensitive in such a medium. The experiments described below have been performed using this configuration.
The rise of thermoplasmonics
Noble-metal nanoparticles (NPs)—for example, made of gold or silver—are known for their strong optical response in the visible range. This is due to the plasmonic resonance of the electron gas of the NP at visible frequencies. In parallel, this plasmonic resonance can be accompanied by a substantial increase in the internal temperature of the NP (see Fig. 1). While this effect is known, it is often considered as a side effect to be minimized. However, the ability to control heat at the nanoscale does open a wide range of applications, limited only by the imagination.
The balance between the optical and thermal energy conversions is just a matter of optimizing the shape and the size of the NP. For instance, while large NPs (diameters greater than 100 nm) are very efficient light-scatterers, small, elongated, flat, or angular NPs turn out to be more efficient nanosources of heat.2
In our first set of experiments, gold nanostructures were designed using e-beam lithography. With such nanostructures, a plasmonic resonance and an efficient subsequent heat generation can be achieved using near-IR (770 nm) laser illumination and an irradiance around 1 mW/µm2.
These conditions are fulfilled using a confocal microscope with a high-numerical-aperture objective. Through the same objective, laser light at a second wavelength (473 nm) is focused on the sample to excite the fluorescence. This light is linearly polarized; the polarization anisotropy arising from the sample is then measured using two avalanche photodiodes. Raster-scanning the sample with respect to the optical axis enables us to form a map of the FPA.
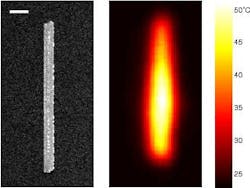
A temperature map was made of a lithographically prepared gold nanowire laying on a glass substrate (see Fig. 2); the map gives an idea of the spatial resolution that can be achieved, which has been estimated to be 300 nm. This technique can be applied using any kind of optical microscope. In the present case, since a far-field measurement of the FPA is performed, the spatial resolution is diffraction limited.
Toward bio-related applications
Bio-related applications based on plasmonic heating are currently under active development. Two main applications are envisioned. For photothermal cancer therapy, the idea is to uptake colloidal gold nanoparticles selectively into cancer cells to perform local heating under IR illumination and destroy the tumor without affecting the healthy surroundings.3 In such an application, very precise monitoring of the temperature is required to ensure safe operation. For drug-delivery applications, the idea is to functionalize gold nanoparticles with some type of drug or drugs and perform the temperature-induced drug release at the desired place and time under IR illumination in-vivo.4
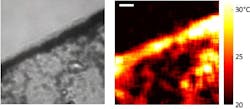
For these two bio-related applications, the morphology of the nanoparticles has to be optimized to push the plasmonic resonance from the visible into the IR. For this reason, elongated NPs or nanoshells are the two more-promising candidates. In this context, we applied the FPA thermal imaging technique to an assembly of dispersed colloidal gold nanorods, 50 nm in length by 12 nm in width.
Temperature measurements were performed on these gold nanorods deposited on a glass substrate (see Fig. 3). Natural variations in the density of the nanorods were achieved by depositing a drop of the nanorod solution on the sample and letting the solution slowly evaporate. Such an experiment was intended to mimic the NP distribution inside a biological cell. Temperature variations of a few tenths of a degree can be measured, which is good enough for practical application in biology and medicine.
Further investigations are now dedicated to applications in real biological environment, nanocatalysis, and fundamental research in thermoplasmonics.
ACKNOWLEDGMENT
This research has been funded by the Spanish Ministry of Sciences through grants number TEC2007-60186/MIC and number CSD2007-046-NanoLight.es, and by the fundació CELLEX Barcelona. MPK and FK acknowledge support from the Ramón y Cajal program.
REFERENCES
1. G. Baffou et al. Opt. Exp. 17, 3291 (2009).
2. G. Baffou et al. Appl. Phys. Lett., in press (2009).
3. P. K. Jain et al., Nano Today 2, 18 (2007).
4. A. G. Skirtach, Nano Lett. 5, 1371 (2005).
Romain Quidant is a professor at the Institute of Photonic Sciences (ICFO) in Castelldefels, Barcelona, ICREA researcher and head of the Plasmon Nano-optics group. Guillaume Baffou, Marj Kreuzer, and Florian Kulzer are postdoctoral researchers at ICFO; e-mail: [email protected], [email protected].


